Debugging React Native Crashes with Firebase Crashlytics
Overview
This guide outlines the step-by-step process for debugging JavaScript exceptions in React Native applications using Firebase Crashlytics. We'll focus on two main debugging approaches.
Understanding Crash Reports
Key Components of a Crash Report
Stack Trace: Contains detailed crash information including:
- Exception type (e.g.,
com.facebook.react.common.JavascriptException) - Error message
- Component hierarchy
- Line numbers and locations
- Exception type (e.g.,
Logs & Events: Shows user actions leading up to the crash
- User interactions
- App state changes
- Navigation flow
Debugging Methods
Method 1: User Journey Recreation
- Open the crash report in Firebase Crashlytics dashboard
- Navigate to "Logs & Events" tab
- Review the sequence of user actions before the crash
- Attempt to reproduce the crash locally by following the same steps
- Use the stack trace to identify the component where the crash occurred
Method 2: Production Bundle Analysis
Obtain Production Bundle
- Download the production APK
- Change file extension from .apk to .zip
- Extract the zip file
- Navigate to extracted_folder/assets/
- Locate index.android.bundle file
Stack Trace Analysis
- Locate the line number reference in stack trace (e.g., @28:89)
- Format: @lineNumber:characterPosition
- Example: @28:89 means line 28, character 89
Code Investigation
- Open index.android.bundle in VS Code
- Use "Go to Line" feature (Ctrl/Cmd + G)
- Enter the line number format: 28:89
- Examine code around this location
- Look for similar patterns in your source code
Example Crash Analysis
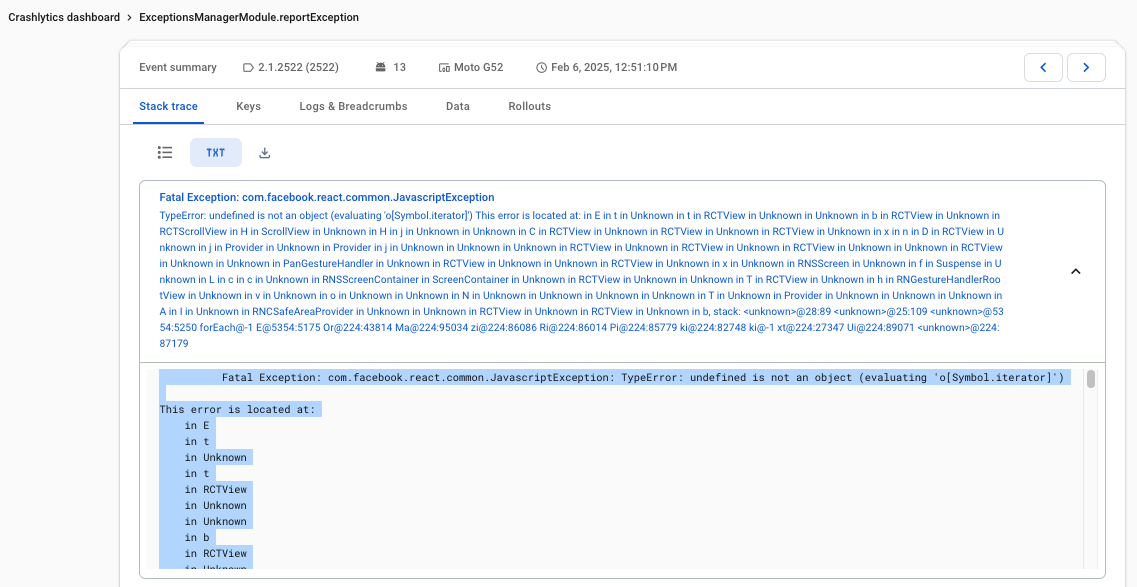
Sample Stack Trace
Fatal Exception: com.facebook.react.common.JavascriptException:
TypeError: undefined is not an object (evaluating 'o[Symbol.iterator]')
This error is located at:
    in E
    in t
    in Unknown
    [... component hierarchy ...]
    in RNCSafeAreaProvider
    stack:
    <unknown>@28:89
    <unknown>@25:109
    [... stack frames ...]
Analysis Steps
- Note the error type: TypeError for undefined object
- Locate crash position: @28:89
- Review component hierarchy for context
- Check bundle file at line 28, character 89
- Look for iterator usage in corresponding source code
Best Practices
When Analyzing Stack Traces
- Always check the complete component hierarchy
- Note any patterns in component names
- Pay attention to error types and messages
- Look for recurring line numbers or patterns
When Reviewing Logs
- Focus on events immediately before crash
- Note any unusual patterns or sequences
- Document reproducible steps
- Check for environment-specific conditions
Common Pitfalls to Avoid
Overlooking Context
- Don't focus only on line numbers
- Consider the full component hierarchy
- Review complete error message
Incomplete Analysis
- Always check both logs and stack trace
- Don't ignore user journey
- Consider different device conditions
Resolution Steps
After Identifying the Issue
- Document the root cause
- Create a reproducible test case
- Implement and test fix
- Verify in similar scenarios
Verification
- Test on multiple devices
- Verify in production bundle
- Monitor crash reports after deployment